Morningness–Eveningness Questionnaire-Based Chronotype Is Correlated with Atherogenic Index of Plasma
Article information

Abstract
Objective
Our study investigated the correlations of individual chronotype, social jetlag (SJL), and sleep duration with levels of atherogenic lipids.
Methods
This cross-sectional study included 1,984 participants who visited the health check-up centers of two tertiary medical institutions from July 2016 to December 2016. Chronotype was assessed by the Morningness−Eveningness Questionnaire (MEQ), and sleep duration and SJL were assessed by a self-reported questionnaire. Simple and partial Pearson’s correlation analyses were used to investigate the relationship between sleep parameters and lipid profiles. Multiple stepwise and enter method regression analyses were used to find independent relationships between MEQ score and atherogenic index of plasma (AIP).
Results
Participants’ MEQ scores were significantly correlated with triglyceride levels (r=-0.088, p<0.01), total cholesterol/high-density lipoprotein (TC/HDL; r=-0.059, p<0.05), and AIP (r=-0.089, p<0.01). Their SJL scores were positively related with TC (r=0.055, p<0.05), while sleep duration was negatively related with HDL-cholesterol (r=-0.053, p<0.01). Partial Pearson’s correlation analysis showed that MEQ score was more strongly associated with AIP (r=-0.089) than with SJL and sleep duration (p=0.011 and p=0.031), respectively. A significant association between MEQ score and AIP was found by multiple linear regression analyses after adjusting for age, sex, body mass index, mean arterial pressure, glucose level, white blood cell count, smoking status, physical activity, alcohol consumption, and dyslipidemia medication (β=-0.002, p=0.009).
Conclusion
Late chronotype is independently and negatively associated with AIP after adjusting for possible confounders, suggesting these individuals are at increased risk for cardiovascular disease and may benefit from chronotherapy to limit its incidence in this population.
INTRODUCTION
Circadian rhythms are intracellular programs that generate selfsustained oscillations approximately every 24 hours [1]. Circadian rhythmicity is controlled by the circadian transcription factors (circadian locomotor output cycles kaput, period, cryptochrome circadian clock, and brain and muscle ARNT-like 1), which are driven by internal central and peripheral clocks [2]. These clocks may also be regulated by many environmental signals, such as temperature, food intake, and social interaction [3] and are differentially controlled by light/dark signals among individuals [4]. Circadian preferences in the timing of sleeping and waking (called chronotypes) vary from extreme “larks” to extreme “owls” [4]. Individuals with an early chronotype (larks) wake up easily in the morning and have difficulty staying awake late at night [5]. Conversely, those with a late chronotype (owls) sleep later and have trouble waking in the early morning [5]. In industrialized societies, most of the population is scheduled to work at the same time, commonly beginning in the morning. As a result, late chronotypes experience significant shifts in sleep time between work days and free days due to social obligations [6]. This discrepancy between an individual’s work time and social time is known as “social jetlag” (SJL) [5,7], which reflects a circadian misalignment [8].
Sleep duration is important for maintaining one’s physical and mental health [9]. The National Sleep Foundation recommends appropriate sleep duration for all ages [10]. As described above, chronotype, SJL, and sleep duration are closely linked [11], imbalances among them, including inadequate sleep duration, have been associated with increased risk for major chronic diseases, such as obesity, metabolic syndrome, and cardiovascular disease (CVD) [6,12-15].
High levels of triglycerides (TG) and low levels of high-density lipoprotein cholesterol (HDL-C) are major risk factors for CVD [16-18] and indicate plasma atherogenicity reflecting metabolic disruption and insulin resistance [19]. Several previous studies have established the impact of chronotype, SJL, and sleep duration on abnormal serum lipid levels [20,21], although their potential relationships have not been extensively investigated. Therefore, we aimed to determine the impact of chronotype, SJL and sleep duration on atherogenic lipid profiles and which sleep-related parameter exhibits a stronger correlation with the atherogenicity.
METHODS
Study population
This study cross-sectional study initially included 2,168 adults who voluntarily attended the medical health check-up program from July 2016 to December 2016 in two tertiary medical institutions (Severance check-up and Gangnam Severance check-up). The participants provided informed consent and responded to a questionnaire to determine study eligibility. We set the exclusion criteria as follows: 1) younger than 19 years of age, 2) missing data, and 3) incomplete questionnaire.
Ultimately, data from 1,984 participants (19–81 years of age) were included in the final analysis. This study was conducted in accordance with the Declaration of Helsinki and was approved by the Institutional Review Board of Severance Hospital (IRB No. 3- 2016-0123).
Covariates
Body weight and height were measured while participants wore light indoor clothing and no shoes. Body mass index (BMI) was calculated as body weight (kg) divided by height (m2 ). Systolic blood pressure (SBP) and diastolic blood pressure (DBP) were obtained from patients in the sitting position after a 10-min resting period. Mean arterial pressure (MAP) was calculated as 1/3 SBP plus 2/3 DBP. Blood samples were collected from patients following an 8-hour fast. Serum glucose, total cholesterol (TC), TG, HDL-C, and low-density lipoprotein cholesterol (LDL-C) levels were measured with the ADVIA 1800 Clinical Chemistry System (Siemens Healthcare Diagnostics, Inc., Tarrytown, NY, USA). White blood cells (WBC) and 25-hydroxy vitamin D levels were measured with the ADVIA 2120i Clinical Hematology System and the ADVIA Centaur XP Immunoassay System, respectively (Siemens Healthcare Diagnostics, Inc.). The TC to HDL-C ratio was calculated as TC divided by HDL-C. Atherogenic index of plasma (AIP) was calculated as the logarithmic ratio of TG to HDL-C [17]. Individuals indicated if they took an anti-dyslipidemia medication. Smoking status, alcohol intake, and physical activity were reported via a self-questionnaire. Smoking status was classified as never-smoker, ex-smoker, and current smoker. Alcohol intake was defined as consumption of alcohol greater than once per week. Physical activity was defined as exercising more than three times a week with moderate to vigorous intensity. We screened for the presence of depression using Patient Health Questionnaire (PHQ)-9, which is composed of nine questions with answers on a 0 to 3 scale; a higher score indicates worse depressive symptoms [22].
Assessment of chronotype and sleep profiles
Chronotype was assessed by a Korean version of the Morningess–Eveningness Questionnaire (MEQ) originally developed by Horne and Ostberg [15,23]. The MEQ consists of 19 questions that assess habitual wakeup times and bed times and periods of best performances and feelings of well-being [23]. The questionnaire results are given as a numeric score ranging from 16 to 86. Higher MEQ scores are correlated with the early chronotype (“larks”).
Participants then responded to the following questions: 1) “What is your average number of work days per week?”; 2) “What time do you usually wake up on work days?”; 3) “What time do you usually fall asleep work days?”; 4) “What time do you usually wake up on the free days?”; and 5) “What time do you fall asleep on free days?”. Midsleep on free days (MSF) and midsleep on workdays (MSW) were calculated as the mid-point between sleep onset and sleep offset on free days and workdays, respectively [5]. To remove the effect of sleep debt from SJL, we used the SJL corrected formula as follows according to Jankowski [7]:
SJLsc=|MSFsc-MSWsc|,
where MSFsc=sleep onset on free days+half of the average weekly sleep duration; and MSWsc=sleep onset on workdays+half of the average weekly sleep duration.
Participants also indicated how many hours they slept on work days and on free days. Sleep duration was calculated as follows: (sleep duration of weekday×number of weekdays + sleep duration of free day×number of free days)/7.
Overall sleep quality was measured by the Pittsburgh Sleep Quality Index (PSQI) instrument [24]. The PSQI is a self-rated questionnaire that generates seven component scores: subjective sleep quality, sleep latency, sleep duration, habitual sleep efficiency, sleep disturbances, use of sleeping medication, and daytime dysfunction. The score of the answers is based on a 0 to 3 scale. A higher score indicates the worse quality of sleep, and a global PSQI score greater than 5 has a diagnostic value for poor sleep.
Statistical analyses
Statistical analyses were performed using SPSS version 23.0 (IBM Corp., Armonk, NY, USA). Data are presented as the means±standard deviations (SDs) or numbers (percentages). Simple Pearson’s correlation analyses were used to investigate correlations between MEQ score, SJL and sleep duration and clinical variables. Pearson’s partial correlation analyses were used to explore correlations between MEQ score, SJL and sleep duration and clinical variables after adjusting for age, sex, and BMI. Differences in absolute partial correlation coefficients and the dependency of two correlated correlation coefficients were evaluated using Steiger’s Z test [25]. To investigate the association between MEQ score, SJL and sleep duration and level of AIP, we stratified these values into tertiles (T) (MEQ score; T1: 16–46, T2: 47–55, T3: 56–86; SJL; T1: <30 min, T2: 31 min–1 h 30 min, T3: ≥1 h 31 min; sleep duration; T1: <6 h 38 min, T2: 6 h 39 min–7 h 30 min, T3: ≥7 h 31 min).
Analysis of covariance was used to analyze associations between MEQ scores, SJL, and sleep duration and level of AIP after adjusting for age, sex and BMI. We used the Bonferroni post-hoc test to assess differences in AIP levels for each MEQ score, SJL, sleep duration tertile group. The stepwise and enter methods for multiple linear regression analyses were used to evaluate independent associations between MEQ score, SJL, sleep duration and AIP after adjusting for age, sex, BMI, MAP, glucose level, WBC, smoking status, physical activity, alcohol consumption, and dyslipidemia medication. The level of statistical significance for all analyses was set as p<0.05.
RESULTS
Table 1 shows the clinical characteristics of the study population. In total, 1,131 males (57%) and 853 females (43%) participated in this study. The mean age±SD and BMI±SD were 47.6±11.7 years and 23.7±3.3 kg/m2 , respectively. The levels of mean MEQ score, SJL, and sleep duration were 50.0±9.1, 1 h 15 min±1 h 16 min, and 7 h 12 min±1 h 26 min, respectively.
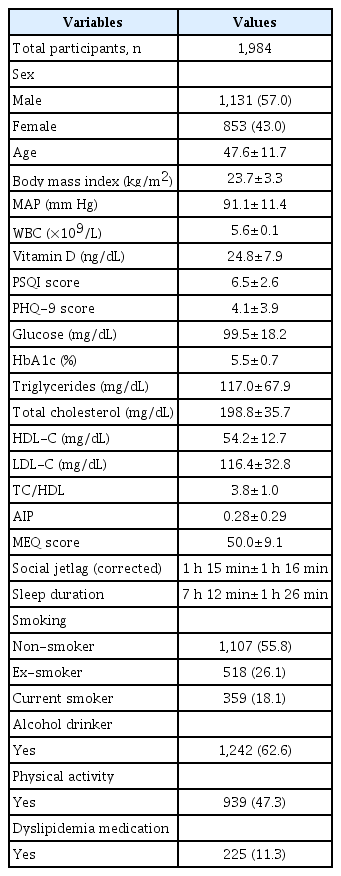
General characteristics of study participants
Table 2 shows relationships between MEQ score, SJL, sleep duration and clinical variables. In the simple Pearson correlation, MEQ scores were significantly positively associated with age, BMI, MAP, glucose, HbA1c, and vitamin D (all p<0.01) but negatively associated with sex, PHQ-9 score, PSQI score, and HDL-C level (all p<0.01). Participant SJL was significantly positively associated with PHQ-9 score, PSQI score, and HDL-C level and negatively associated with age, BMI, and levels of serum glucose, HbA1c, and vitamin D. Sleep duration was significantly negatively associated with age, BMI, and PSQI score.
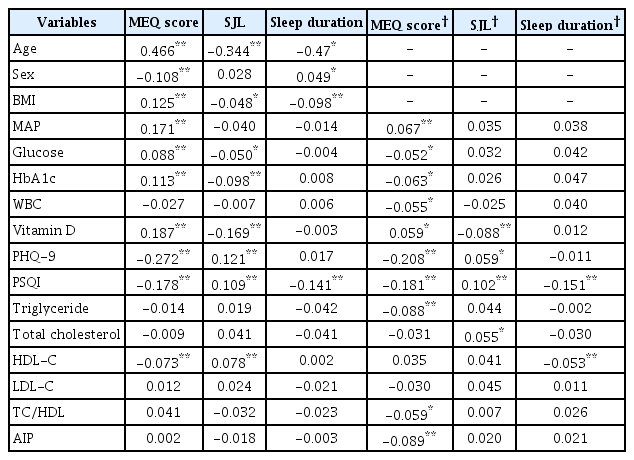
Correlation between sleep parameters and clinical variables
The partial Pearson’s correlation coefficients for MEQ score, SJL, sleep duration and lipid profiles are shown also in Table 2. After adjusting for age, sex, and BMI, we found significant associations between MEQ score, SJL, sleep duration and lipid profiles. MEQ score was significantly correlated with TG (r=-0.088, p<0.01), TC/ HDL (r=-0.059, p<0.05), and AIP (r=-0.089, p<0.01), while SJL was only significantly positively related with TC (r=0.055, p<0.05). Sleep duration was only significantly negatively related with HDLcholesterol (r=-0.053, p<0.01).
Table 3 shows the comparisons of correlation coefficients of MEQ score, SJL, sleep duration and lipid profiles. Partial Pearson’s correlation analysis showed that MEQ score was more highly associated with TG levels (r=-0.088) than with sleep duration according to Steiger’s Z test (p=0.006). The analysis also showed that MEQ score was more strongly associated with AIP (r=-0.089) than with SJL and sleep duration (p=0.011 and p=0.031), respectively. Sleep duration was more highly associated with HDL-C (r=-0.053) than with SJL (p<0.001).
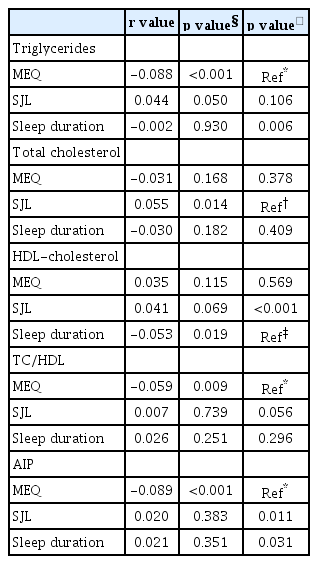
Comparison between correlation coefficients for sleep parameters and lipid profile data
Figure 1 presents the associations between MEQ score, SJL, and sleep duration tertile groups and AIP after adjusting for age, sex, and BMI. Values of AIP were significantly different among the MEQ score tertile groups; for example, the highest MEQ score tertile group had a significantly lower level of AIP compared to the lowest MEQ tertile group (T3: 0.266 vs. T1: 0.298, p=0.002) (Figure 1A). We observed no significant differences in AIP among the SJL and sleep duration tertile groups (Figure 1B and C).

Associations between MEQ score (A), SJL (B), sleep duration (C), and AIP. *p<0.05. AIP: Atherogenic index of plasma, MEQ: Morningness–Eveningness Questionnaire, SJL: social jetlag, T: Tertile.
Table 4 shows the independent association of MEQ score and AIP using multivariate adjusted models for multiple linear regression analysis, which identified MEQ score as a significant independent factor associated with AIP (β=-0.001, p=0.038) according to stepwise analysis. The enter method for multiple linear regression revealed a significant association between MEQ scores and AIP after adjusting for age, sex, BMI, MAP, glucose level, WBC, smoking status, physical activity, alcohol consumption, and dyslipidemia medication (β=-0.002, p=0.009).
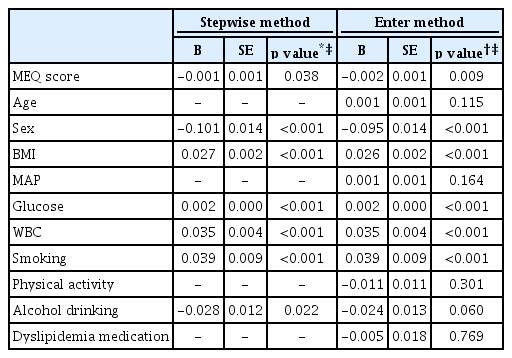
Multiple linear regression analysis of MEQ score and AIP
DISCUSSION
In the current study, we found that MEQ score is significantly negatively correlated with AIP after adjusting for confounders and is more strongly correlated with AIP than with SJL and sleep duration. This finding suggests that an individual’s chronotype could be more robustly related to an increased risk of atherosclerotic CVD (ASCVD) than SJL and sleep duration. Our study’s results corroborate those from previous studies, which have established that late chronotype is associated with type 2 diabetes [26], metabolic syndrome [15], hypertension [27], and mortality [28]. Knutson and von Schantz [28], for the first time, reported that those with the late chronotype have an increased risk of mortality (hazard ratio 1.10, 95% confidence interval 1.02–1.18) in a prospective study. Reutrakul et al. [26] showed that the late chronotype is also associated with worse glycemic control in type 2 diabetes patients, independent of subjective sleep debt, insufficient sleep duration, and sleep quality. Moreover, Osonoi et al. [29] reported that type 2 diabetes patients with the late chronotype had significantly high levels of TG, glucose, and HbA1c and low levels of HDL-C compared with those with the early chronotype.
In the presence of excessive insulin, hypertriglyceridemia is a characteristic feature [30], as insulin suppresses lipolysis by inhibiting hormone-sensitive lipase activity and causing TG accumulation in adipose tissue [31]. Insulin also inhibits the transfer of TG to ApoB, which leads to overproduction of very low-density lipoprotein (VLDL) in the liver [30]. Hypertriglyceridemia also stimulates an increase of TG-enriched HDL and LDL; the former is easily catabolized and results in reduced serum HDL levels, while the latter becomes small, dense LDL through hydrolysis via lipoprotein lipase.
Circadian misalignment often leads to SJL [7], which many researchers have found is associated with cardiometabolic disorders, such as obesity [6], diabetes [14] and dyslipidemia [32]. In our study, we found significant correlation only between SJL and TC after adjusting for age, sex, and BMI. Our findings show some discrepancy compared with those of previous studies. Wong et al. [32] reported that SJL is significantly correlated with lower HDL, higher TG, and higher glucose. However, another populationbased study conducted in Germany found that SJL greater than 2 h is significantly associated with high levels of glucose and a greater waist circumference but is not associated with serum HDL and TG levels [14].
Sleep duration is also important for maintaining an individual’s well-being and physical health [10]. In the current study, longer sleep duration was significantly correlated with lower HDL levels after adjusting for age, sex, and BMI (r=-0.053, p<0.01). The relationship between sleep duration and lipid profiles are inconclusive. A study in Taiwan [33] found that sleep duration was not related with high TG and low HDL levels, while another study identified a U-shaped association between sleep duration and serum HDL levels [34].
In the current study, we found that MEQ score is strongly correlated with AIP, which suggests that chronotype is associated with atherogenic lipid profiles that predispose individuals to ASCVD. Although the nature of the relationship between MEQ score and AIP is unclear, some evidence supports our present findings. First, light exposure at night disrupts energy metabolism, such as gluconeogenesis and lipogenesis, and leads to increased risk of metabolic syndrome and obesity [35,36]. Prolonged light exposure also increases inflammation, which has a strong link to cardiometabolic disease [35]. Late chronotypes are prone to artificial light exposure late at night. Relatedly, Nimitphong et al. [37] reported that the late chronotype is associated with higher level of C-reactive protein, a standard marker of systemic inflammation. During inflammation, pro-inflammatory cytokines, including TNF, IL-1, and IL-6, which alter lipid metabolism [38], are produced. Inflammation also leads to increased TG, VLDL, and small, dense LDL and decreased HDL.
Second, circadian clocks are principal regulators of lipid absorption, metabolism, and transport [39]. In an animal study, mice with mutated clock genes developed hypertriglyceridemia [40]. In the peripheral clock, liver oscillation is more sensitive to feeding time than other zeitgebers [39], and night-restricted feeding shifts the phase of TG accumulation and reduced hepatic TG levels in mice [41].
Juda et al. [42] found that chronotype modulates sleep duration and sleep quality. Regarding SJL, several studies have suggested that weekend “catch-up sleep” may attenuate the undesirable effects of the late chronotype and substantial SJL [43,44]. Numerous studies have established that U-shaped association between sleep duration and cardiometabolic risks, but statistical approaches such as correlation and regression analyses may be insufficient to fully characterize the relationship between sleep duration and continuous variables that compose lipids profiles. Therefore, clarifying the association between catch-up sleep and metabolic disorders in future studies is needed.
Our study has several limitations. First, sleep-related indicators were assessed by self-reported questionnaires. Thus, we could not verify actual sleep time or exact MSW and MSF. Discrepancies in actual midsleep time and sleep duration may have been present. Further study using objective tools, such as actigraphy, is needed. Second, we could not consider all possible confounders, including dietary factors (e.g., meal time and dietary intake). Third, the study lacked information regarding actual light exposure time. Despite of these limitations, the strength of our study is that, for the first time, we have revealed strong relationships between sleep parameters (chronotype, SJL, and sleep duration) and AIP.
In conclusion, we found that the late chronotype is independently and negatively associated with AIP, which is a valuable marker for predicting CVD. Furthermore, we clarified that chronotype is more strongly correlated with AIP than with SJL and sleep duration. Chronotherapeutic medicine, such as light therapy and sleep phase advance, could be beneficial for reducing incidence of CVD in individuals with the late chronotype.
Acknowledgements
This work was supported by the Technology Innovation Program (20002781, A Platform for Prediction and Management of Health Risk Based on Personal Big Data and Lifelogging) funded by the Ministry of Trade, Industry & Energy (MOTIE, Korea). This study was supported by a 2018 faculty research grant from Yonsei University College of Medicine (6-2018-0090) to Yu-Jin Kwon.
Notes
The authors have no potential conflicts of interest to disclose.
Author Contributions
Yu-Jin Kwon and Ji-Won Lee: conception and design of the study, or acquisition of data, or analysis and interpretation of data, drafting the article or revising it critically for important intellectual content, final approval of the version to be submitted.