


INTRODUCTION
Metabolic syndrome (MS), initially described by Gerald Reaven in 1988 as “syndrome X” or “insulin resistance syndrome,” is a collection of common irregularities, including resistance to insulin, impairment of glucose tolerance, central obesity, reduced high-density lipoprotein (HDL)-cholesterol levels, elevated triglycerides (TG), and hypertension. The condition reflects the sedentary lifestyle, over nutrition, and resultant excess adiposity of the modern world [1]. The International Diabetes Federation (IDF) [2] released a global consensus definition for MS; this definition identified central obesity as an essential component of MS in addition to any two of the following four findings: 1) elevated serum TG: ≥150 mg/dL or history of medication administration for this hyperlipidemia; 2) low levels of HDL-cholesterol: <40 mg/dL in males and <50 mg/dL in females or medication administration for such reduced levels; 3) hypertension: with systolic blood pressure (DBP) ≥130 mm Hg or diastolic blood pressure (DBP) ≥85 mm Hg, or administrating antihypertensive drugs; and 4) raised fasting blood glucose (FBG): ≥100 mg/dL or previously diagnosed type 2 diabetes mellitus (DM).
On the other hand, the Third Report of The National Cholesterol Education Program (NCEP) Expert Panel on Detection, Evaluation, and Treatment of High Blood Cholesterol in Adults (Adult Treatment Panel III) [3] defined MS as follows: 1) abdominal obesity in which waist circumference (WC) >102 cm in men, and >88 cm in women; 2) TG ≥150 mg/dL; 3) HDL-cholesterol <40 mg/dL in men and <50 mg/dL in women; 4) blood pressure (BP) ≥130/≥85 mm Hg; and 5) FBG ≥110 mg/dL.
The circadian rhythms are a sequence of endogenous autonomous oscillators created by the molecular circadian clock, which synchronizes internal time with the external environment in a 24-h daily cycle [4]. The interconnections between circadian rhythm disruption and metabolism clarify the significance of chronobiology in preventing and treating type 2 DM, obesity, and hyperlipidemia [5].
Chronotype is the tendency of a person to sleep at a particular time during the 24 hours. It is primarily regulated by the circadian clock but constrained by work obligations to a specific sleep schedule. The discrepancy between biological and social time can be described as social jetlag [6]; 69% of adults are documented to have at least 1 hour of social jetlag [7].
Social jetlag is the discrepancy in timing between the circadian and social clock [8]. Social jetlag represents the dissimilarity between sleeping and waking hours on free days (determined by individual predilection) and workdays (established by social and work obligations) [9]. Later chronotype and greater social jetlag were related to a higher body mass index (BMI) and obesity [10]. In a study including 792 individuals, there was an association between social jetlag and consumption of meals and snacks at delayed times of the day [11]. Furthermore, social jetlag was associated with the total calories consumed, particularly proteins, total fats, saturated fat, and cholesterol, all over the day, which proved the negative effect of circadian disturbance on food intake [11]. Uncoupling circadian-controlled activities like sleeping and eating from endogenous circadian rhythm negatively affect lipid and glucose metabolism, insulin regulation and may lead to obesity, such as seen in shift workers. In one experimental study, insulin sensitivity decreased, leptin secretion was suppressed, and the rhythm of cortisol was completely inverted in 10 adults following the uncoupling of circadian regulated behaviors from their biological rhythm [12].
The mechanism by which the social disturbances increase the susceptibility to developing MS is not fully understood; however, circadian rhythm disruption is suggested to disturb the suprachiasmatic nucleus, which controls the endogenous circadian rhythm and regulates the hypothalamus pituitary adrenal (HPA) axis [13]. Disturbance of the HPA axis was reported to increase the risk of developing visceral obesity and MS [14]. The activity of the sympathetic nervous system was reported to increase following sleep restriction or fragmentation [15]. Cortisol level showed significant elevation in the afternoon and evening periods following sleep restriction, which led to insulin resistance [16]. To our knowledge, no previous study combined detection and screening of the association between social jetlag, obesity, MS, and nocturnal eating syndrome (NES) in a single study. These multiple factors are thought to negatively affect the prognosis and management plan of target patients, which reflects the importance of the current research. We hypothesized that social and circadian rhythm disruption negatively impacts patients with obesity and MS. This study aimed to detect the associations between obesity, MS, NES, and social jetlag.
METHODS
Study subjects
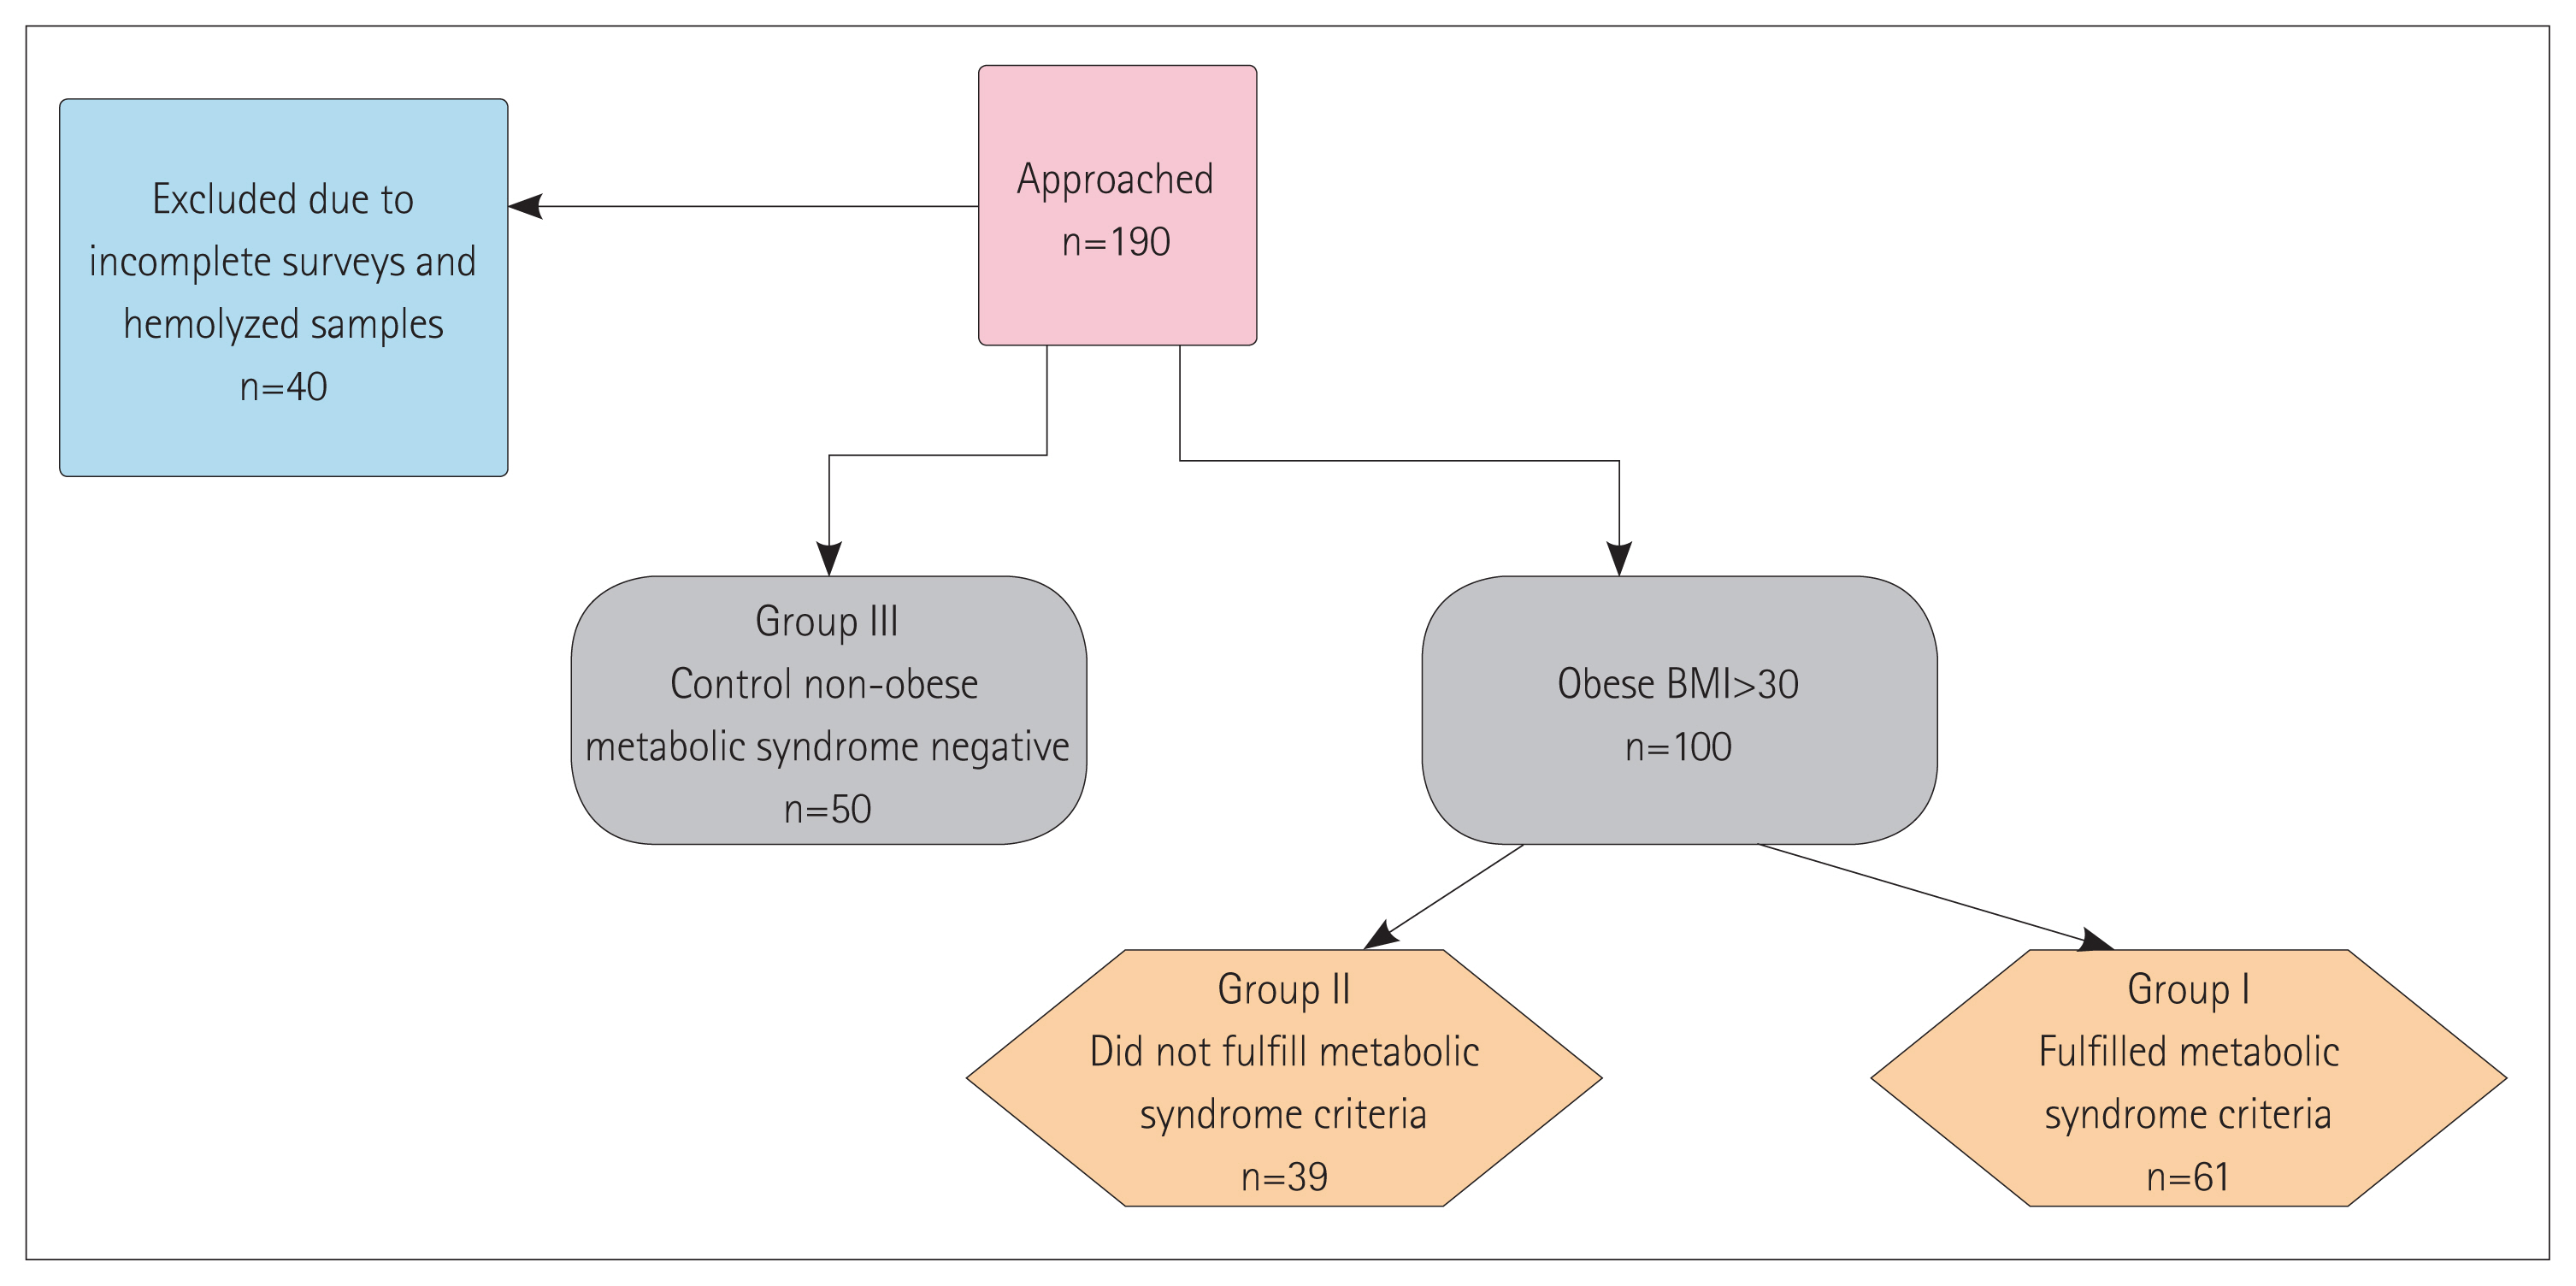
This is a cross-sectional case-control study that was approved by the Institutional Review Board of the Faculty of Medicine, Mansoura University (Approval number MS/17.12.188). One hundred and fifty participants were recruited on a consequent base over one year from April 2019 to April 2020 after informed written consent to participate in the study and that on publishing the research, no personal data will be revealed. Participants were recruited from the obesity outpatient clinic at the Specialized Medical Hospital, Mansoura University. Participants included in this study were divided into three groups: obese with MS; obese subjects not fulfilling the criteria of MS; and nonobese group (the control group). Figure 1 summarizes the stepwise study methodology.
MS was diagnosed according to the IDF criteria updated in 2006 [2], which require central obesity plus two of the following: 1) TG ≥150 mg/dL or treated for raised TG; 2) HDL-cholesterol <40 mg/dL in men or <50 mg/dL in women, or on treatment for reduced HDL; 3) SBP ≥130 mm Hg, DBP ≥85 mm Hg, or on antihypertensive treatment; and 4) FBG ≥100 mg/dL or previously diagnosed type 2 DM.
We excluded patients who were older than 60 years old or younger than 22 years old (this age range was chosen to be excluded to avoid the impact of age on the circadian pattern and chronotype preference), patients with mental illness, patients with organ failure, patients using drugs that may affect sleep, and shift workers.
Each participant recruited in this study was subjected to history taking related to chronic illnesses and prescribed drugs. BP measurement using a manual sphygmomanometer, anthropometric measures, including weight, height, BMI, WC, and hip circumference (HC) were recorded.
During the collection of anthropometric data, participants were instructed to keep on only light clothes without shoes. Height and weight were measured to the nearest centimeter and kilogram, respectively. WC and HC were measured to the nearest 0.1 cm. Measurements were done via bypassing the measuring tape through the midpoint between the superior iliac crest and the lowest rib WC. HC was measured at the maximum protuberance [17]. BMI was calculated using the Quetelet Index=body weight (kg) divided by height squared (m2) [18].
Questionnaires
Assessment of circadian rhythm and the social pattern was obtained by applying the revised Morningness-Eveningness Questionnaire (MEQ) [19]. The MEQ total score was interpreted as morning-type (M-type: score 18–25), neither-type (N-type: score 12–17), and evening-type (E-type: score 4–11). We used the validated Arabic abridged shorter version [20].
All participants completed the Arabic translated and validated version of the Night Eating Questionnaire (NEQ) [21,22]. The NEQ is a 14-item questionnaire that assesses the behavioral and psychological symptoms of the NES. Questions 1, 4, and 14 are inversely scored. The total score included questions 1–12 and 14, while question 13 was not included in the total score but was used to exclude parasomnias. Also, question 15 was not added to the total score, but instead, it was used as an indicator of the course of symptoms. Questions 16 and 17 were used to confirm the presence of distress or impairment if the NES was present. The questions scored on a five-grade Likert’s scale (scoring from 0 to 4), except for question 7. It was considered that individuals with a score of 25 or greater are suggested to have NES, and those with a score of 30 and above have strong evidence that they have NES [22].
Sleep Timing Questionnaire [23] includes 18 questions and provides an exact outline of an individual’s typical sleep schedule like the time preferred for going to bed and wake up, frequency of night awakenings, and stability of sleep schedules [24]. We used the translated validated Arabic version [25].
Social jetlag was measured using the following steps, which were adopted from [11]. The participants were asked about the following parameters: When do you commonly go to sleep on weekdays? How long do you stay awake in bed before you go to sleep (after lights off) on weekdays? When did you commonly get up on weekdays? When do you commonly go to sleep at week-ends? How long do you stay awake in bed before you go to sleep (after lights off) at weekends? When do you commonly get up at weekends? Lastly, social jetlag was determined by calculating the variance between mid-sleep time on weekends and weekdays, as the mid-sleep phase is the best phase presenter point for melatonin onset, which is an important circadian rhythm marker [26]. Those with a difference of more than one hour were considered suffering from social jetlag, while those with less than one-hour difference were considered free from social jetlag.
Laboratory measurements
FBG, fasting insulin, lipid profile, and liver and kidney function were measured. A fasting venous sample was collected from every participant in the study into a plain tube. The sample was left to clot for 20 minutes, then centrifuged at 3,000 rpm at room temperature; clear non-hemolyzed sera were separated and divided into two aliquots. One was used for the traditional lab investigation (liver function, serum creatinine, and lipid profile), and the other aliquot was left frozen at −20°C till analysis of serum insulin. Serum insulin was assayed by ELISA kits supplied by ImmunoScape Corporation (Netherland).
Statistical analysis
The SPSS software (version 25.0; IBM Corp., Armonk, NY, USA) was used for data entry and analysis. Qualitative data were expressed as frequencies and percentages. Quantitative data were initially tested for normality using Kolmogorov-Smirnov and Shapiro-Wilk’s test, with data being normally distributed if p>0.050. The presence of significant outliers (extreme values) was tested by examining boxplots. Quantitative data were expressed as the median and interquartile range, as the data was not normally distributed. Qualitative data for more than two groups (e.g., 2×3 table) were done by ANOVA and chi-square test (with Bonferroni method to adjust p values when comparing column proportions). For the quantitative data, the Kruskal-Wallis H test was used due to the skewed distribution of data and significant outliers. Pairwise comparisons were used to properly compare each pair of data. Evaluation of the diagnostic presentation or the accuracy of a test to distinguish diseased from non-diseased cases was done using receiver operating characteristic (ROC) curve analysis. ROC curves were also used to compare the diagnostic performance of two or more diagnostic tests [27]. The likelihood of a diagnosis and associations were assessed using logistic regression analysis calculation of the crude odds ratio with its 95% confidence interval (CI).
RESULTS
Patients in obese with MS group were the eldest in the study sample (older than obese subjects not fulfilling the criteria of MS and controls), with a mean age of 52 years, which was statistically significant. In general, the percentages of males were higher than females (49.2% in obese subject with MS, 69.2% in obese subjects not fulfilling the criteria of MS, and 66% in controls). Table 1 shows that sex distribution was statistically significant, with a higher proportion of females among obese with MS. BMI, WC, and HC were statistically significantly higher in obese with and without MS compared to the controls. Waist hip ratio (WHR) had no statistically significant difference between the three groups. SBP, DBP, and mean arterial blood pressure (MBP) were all significantly higher in the obese with MS group compared to both the obese without MS and control groups. For the laboratory data of the participants, we found that FBG and TG were significantly higher in the obese with MS group compared to both the obese without MS and control groups. Low-density lipoprotein (LDL) was significantly higher in the obese with and without MS compared to the controls. There was no statistically significant difference between the three groups regarding serum creatinine, aspartate transaminase (AST), alanine transaminase (ALT), and AST/ALT ratio. Regarding albumin, a statistically significant difference existed only between the obese with MS group and the controls. HDL was significantly lower in obese with MS than obese without MS than control. Meanwhile, in regard to the chronotype profile of the study sample, it can be noticed that there is no statistically significant difference in the distribution of chronotypes in the three study groups. It also shows the scores of the NEQ among the sample of the study participants. A statistically significant difference in the distribution of the NEQ was seen in the three study groups. There was a higher NEQ score in obese with MS group compared to the other two study groups. This difference was statistically significant. As for the social jetlag, no statistically significant difference was detected in the distribution of social jetlag between the three study groups. These results are summarized in Table 1.
Table 2 presents the correlations between NEQ and social jetlag score and other parameters. There was a statistically significant positive correlation between the NEQ score and BMI (in the obese with MS group), sleep latency, and minutes staying awake on week-days and weekends (in the obese with MS group), and a statistically significant negative correlation between the NEQ score and social jet lag (in both obese with and without MS groups). A statistically significant positive correlation was detected between social jetlag and TG (in the obese with MS group) and FBG (in the obese subjects with MS). Additionally, there was a statistically significant negative correlation between social jetlag and HDL (in the obese subjects without MS) and the total NEQ score (in both obese with and without MS groups). No statistically significant correlations were detected in all other tested parameters.
Table 3 presents the univariate analysis of the associations of the likelihood of occurrence of the MS in obese patients. The univariate regression analysis model showed that total cholesterol (TC), age, NEQ score, the sleep latency rank, and the rank of awakening after sleep were significantly associated with MS in obese patients. For everyone, a unit increase in TC, age, and NEQ score, obese patients have 1.012, 1.077, and 1.132 higher odds to exhibit MS, respectively.
Binomial logistic regression was performed to ascertain the effects of TC, age, NEQ score, and staying awake at weekends on the likelihood that participants have MS. The logistic regression model was statistically significant, χ2(6)=43.125, p<0.0005. The model correctly classified 77% of cases. Sensitivity was 82%, specificity was 69.2%, positive predictive value was 80.6%, and the negative predictive value was 71.1% (Supplementary Figure 1). Of the 6 associated variables, age ≥42.5 years and TC ≥139 mg/dL were statistically significant independent associations as shown in Table 4. Patients with age ≥42.5 years had 9.8 times higher odds to exhibit MS, and patients with TC ≥139 mg/dL had 6.7 times higher odds to exhibit MS.
DISCUSSION
In this study, we tried characterizing the chronobiology and eating habits in patients with MS in a trial to find further prevent-able risk factors, thus improving patient outcomes. The total scores of NEQ was also higher in study obese with MS. Social jetlag was positively associated with TG and FBG levels in obese subjects with MS and negatively associated with HDL and cholesterol in obese subjects not fulfilling the criteria of MS. These main findings of this study indicate that the MS can be worsened in a certain population who have social jetlag and are generally obese and that obesity is not only controlled by eating habits and physical exercise, but other risk factors can affect its severity and medical complications.
There are numerous mechanisms by which circadian rhythm disruptions can impact obesity and MS, as summarized in a review by Hernández-García et al [28]: 1) The adipose tissue, as a peripheral tissue, contains clock genes that regulate the rhythmic expression of adipokines (adiponectin, leptin, and resistin, among others) and therefore, is associated with the appearance of obesity and MS; 2) Clock genes are expressed in body fat, both the subcutaneous and visceral fat; 3) Adiponectin (ADIPOQ) and its receptors, ADIPOR1 and ADIPOR2, are considered a protective factor against obesity and MS. All of them showed a significant decrease of circadian rhythmicity in patients’ adipose tissue with severe obesity. Finally, leptin, another adipokine, also displayed an association with circadian rhythmicity.
Our results revealed that age was higher in the obese with MS group compared to the other two groups. This coincides with Devers et al. [29] whose study showed that the prevalence of MS and the individual MS components increased with age. In this study, the level of serum albumin was lower in obese with MS compared to the other two groups. This was in contrast to the study conducted by Cho et al. [30], which revealed that higher serum albumin levels were associated with an increased prevalence of MS. This might be due to the cultural differences in the type of meals eaten in the current study locality, where carbohydrates form the main component of the meals rather than proteins.
In the current study, chronotype did not show statistically significant differences between the three studied groups. This finding matches Cespedes Feliciano et al. [31] who showed no significant association between chronotype (assessed by MEQ) and obesity among males.
The association between NES and obesity has not been thoroughly evaluated. Our results showed that the total NEQ score was statistically significantly higher in the obese patients with MS group compared to the other two groups (p<0.0005). The prevalence of participants with a total NEQ score >30 was 11.5% of the obese group with MS and 5.1% of the obese group without MS, while 0% of the control group belonged to those with a total score >30. NES prevalence of 9.7% has been reported in diabetes, and participants with nocturnal eating symptoms were more likely to be obese [32]. Also, the studies by Yoshida et al. [33] and Islam et al. [34] agreed with our results as it showed a higher probability of developing MS among women with nocturnal eating habits. These current results contrast with Calugi et al. [35] whose study showed no difference in MS occurrence between participants with and without NES. This may be due to including patients with BMI ≥35 and defining the MS according to the modified Adult Panel Treatment-III.
The total NEQ score in our study was positively associated with BMI in the obese group with MS (p=0.049). This was in harmony with a research study examining the relationship between nocturnal eating habits (defined as dinner immediately before bed and snacks after dinner based on the conventional National Health and Nutrition Examination Survey) and components of MS and found that people with both nocturnal eating habits had a higher probability of developing obesity [33]. Also, the study conducted by Allison et al. [22] investigating eating disorders in type 2 DM revealed that there was higher BMI in those with eating disorders group [using both NEQ for diagnosis of NES and Eating Disorder Examination-Questionnaire for diagnosis of binge eating disorder (BED)].
People with nocturnal eating habits were supposed to have higher TG levels and diminished insulin sensitivity. Low nocturnal insulin sensitivity leads to low lipoprotein lipase activity and causes higher circulating plasma TG levels [33]. Our study revealed different findings; it showed no statistically significant correlation between NEQ score and WC, HC, FBG, MBP, TC, TG, LDL, and HDL cholesterol. These results are coinciding with Calugi and colleagues [35,36] who stated that there is no association between NES and the components of MS (BP, blood glucose, WC, HC, TG, and HDL cholesterol). Furthermore, Allison et al. [37] supported these findings by revealing that there were no differences between those with and without eating disorders (NES and BED) regarding WC, SBP, DBP, TG, and HDL cholesterol.
Social jetlag is the mismatch between biological and social timing; social jetlag has been measured as the discrepancy of midsleep time on weekdays and weekends. Social jetlag has been suggested to induce obesity and cardiometabolic abnormalities [34]. Our study revealed that the number of patients having social jetlag was higher in the obese group with MS compared to the other two groups, but there was no statistically significant difference. The current study results concur with a five-year (2007–2011) cohort study that aimed to determine the impact of circadian disruption on serum lipids, and there was also no significant association between MEQ score and HDL cholesterol [38]. The current study results agree to the study of Kanterman et al. [39] that used Munich Chronotype Questionnaire (designed by Roenneberg) [40] to assess chronotype in shift workers, but found no association between chronotype and and HDL cholesterol nor TG.
On the contrary, this differs from the New Hoorn Study, in which social jetlag increased the risk of MS in younger patients (<61 years) [41]. Additionally, some other researchers found no correlation between chronotype (using MEQ) and HDL cholesterol nor TG levels [31,42]. The results of previous studies are so contradictory and conflicting regarding this area. One study investigating the metabolic impact of evening chronotype in 101 middle-aged male workers with type 2 DM showed a significant correlation between MEQ and HDL cholesterol [43]. Also, Tomizawa et al. [38] revealed a significant association between MEQ and TG.
In the current study, social jetlag showed no statistically significant association with BMI, WC, HC, and WHR. These results were similar to [44]. However, this was unlike an alternative study, which showed that social jetlag was associated positively with BMI and WC [42]. Additionally, the New Hoorn Study revealed that those with greater social jetlag had higher WC [41]. Furthermore, our study revealed that social jetlag was positively correlated with FBG (p=0.012). An observational study reported earlier by the New Hoorn Study found that higher blood glucose level was associated with greater social jetlag [41].
This study further documented that obesity is not only related to overeating and decreased physical activity, but other alternative factors play a role in the metabolic profile. Unfavorable metabolic symptoms are usually associated with disrupted social rhythm and nocturnal eating. Additionally, we managed to compare obese patients with and without MS to a control group. We screened for nocturnal eating using a standardized objective questionnaire, and this eating pattern was rarely taken into account in other studies; this might indicate that we should consider chronobiological aspects when treating obesity and its metabolic complications.
This study has some limitations. First, the cross-sectional design did not help with the inference about the causality and follow up of metabolic profile. Second, the small sample size might limit the generalizability of results. Third, although the question-naires are validated, they still are subjective and could depend on the patient’s subjective feelings at the time of the interview, and objective measurement of caloric intake or sleep profile could have been more informative. Finally, we had no enough information about important confounding factors including physical activity, alcohol consumption, smoking, comorbidities (diabetes mellitus, hypertension, dyslipidemia) and concurrent medication (lipid lowering agents, glucose lowering agents, and others), which are highly associated with the development of MS.
MS (syndrome X) is a multiplex risk factor that arises from insulin resistance in addition to abdominal adiposity. TC, NEQ score, age, sleep latency rank, and awakening after sleep were significantly associated with MS in multivariate logistic regression.
Screening for circadian rhythm disruptions should be included as a routine assessment step with obese patients. Nocturnal eating behaviors are more common in obese patients with MS, and the role of chronotherapy should be further investigated in the management plan of such patients.